 Anil Computers 18/368, PREM KUTIR, UNIVERSITY ROAD, UDAIPUR - 313001RAJASTHAN, INDIA
 [email protected]@[email protected]
 09414234600, 7737447183
InfoGraphic chart in Excel
Sales का performance देखने के लिए Infographic chart बनाते है
किसी company की sales report क्या रही है ये देखने के लिए हम Info graphic chart बना सकते है
First Table-
| Product | Sales Record |
| Samsung | 56% |
| LG company | 76% |
| Sony | 86% |
| Panasonic | 94% |
| Sharp | 63% |
| TCL | 52% |
| Philips | 89% |
Second Table-
| G | H | |
| 1 | Samsung | Pending |
| 2 | 56% | 44% |
=VLOOKUP(G1,A1:B8,2,0)
=VLOOKUP(Product Cell, selet first table,no.of column 2,0)
=100%-G2
इससे Product की sale जितने % रही है वो बताएगा और कितना % बाकी रहा वो pending में बताएगा
Chart insert करना
Step 1:
- Chart Pie chart doughnut(डोनट) chart insert करना
- chart design > select data > add
- Series Name - Name /no name खाली रखना
Series value - ={1,1,1,1,1,1,1,1}
10, 15, 20 तक लिखना है
ok
[Note - पहले blank chart ही insert करना हैं]
Step 2 :
select doughnut chart > Right click > Format data series > doughnut hole
size (कम करना है अपने according)
Step 3 :
right click > select data > add
-Series Name - खाली रखना है
Series values - select
- Sales record - Pending
56% 44%
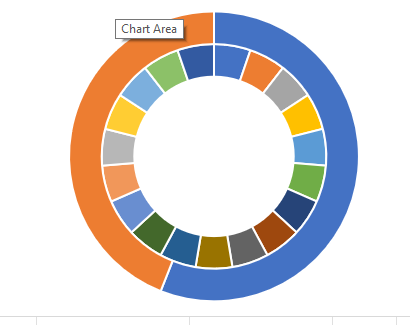
- बाहर वाले chartको select करना है |
- Right click >change series chart type > secondary axis > ok
(दो chart से एक ही हो जायेगा एक के ऊपर आएगा)
- आगे वाले Chart को select करना है orange part - No fill
- Rest part select (blue) >fill white >transparent बढ़ाना |
- यदि single color लेना हो तो -
Right click > change series chart type >secondary axis ( ) untick > fill >single color
- again secondary axis को (Right) लगाना हैं ताकि दोनो chart show हो
- अब हम यह चाहते है की किस product की sales हमारे सामने आ जाए |
insert shape - oval
shape अंदर oval shape बनाना है center मे बनाना है
product sales report pending
samsung 56% 44%
- click on formula bar >
=select 56% cell >
center alignment >
and increas font size >
- Right click on shape >
format object (shape option)
size and properties >
text box
Left, Right ,Top , Bottom margin - 0
Properties
Select - don't move or size with cells
chart के लिए भी यही option select रखना है ताकि chart और shape move ना हो
- बाहर वाला Rectangle box
>insert >
shape Rectangle (create)>
click on formula bar
=select sales report
Thanks to ChatGpt
Thanks to Google